Chart Report Sample Answer
Chart Report Title: The Number Of Houses Built Per Year In Two Cities
Keywords or Topics: house
The samples about "The number of houses built per year in two cities" are handy resources for students to enrich their writing skills of chart report.
Besides, more chart report questions sharing the topic of "house" are added to help students understand the different requirements and target the assignments precisely.
| Actions & New chart report examples |
| Chart questions and samples |
Question:
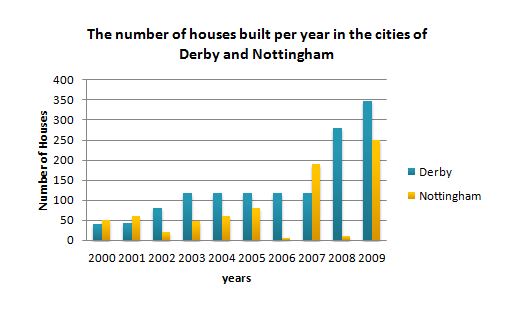
The diagram below shows the number of houses built per year in two cities, Derby and Nottingham, from 2000 to 2009.
Write a report for a university lecturer describing the information shown below.
Write at least 150 words.
Write a report for a university lecturer describing the information shown below.
Write at least 150 words.
Answer 1
The bar chart shows the number of houses built in two neighboring cities, Derby and Nottingham, between 2000 and 2009...
Overall, the number of houses built in Derby exceeded the number built in Nottingham. The trend for Derby was decidedly upward, with a steady rise from 40 new houses in the first year to just under 120 in 2003...
House building in Nottingham, by comparison, was much more erratic. In the first two years of the decade, more houses were built in Nottingham than in Derby...
Band: 7.5
Word Statistics
| Group | Word Number | Distinct | Percent |
|---|---|---|---|
| All Words | 202 | 92 | 45% |
| Top 300 Words | 95 (47%) | 30 (32%) | 31% |
| 300 - 1000 Words | 38 (18%) | 17 (18%) | 44% |
| Over 1000 Words | 69 (34%) | 45 (48%) | 65% |
Other Comments (jadelee)
Link Words: 6 (including link phrase: 0)
Sentences: Number: 11; Average Length: 100 characters; Words/Sentence: 18
Repeated Words: houses(7), built(6), derby(6), number(5), nottingham(5), years(4), two(3)