Chart Report Sample Answer
Chart Report Title: The Changes In The Proportion Of The Australian Workforce Employed
Keywords or Topics: job
The samples about "The changes in the proportion of the Australian workforce employed" are handy resources for students to enrich their writing skills of chart report.
Besides, more chart report questions sharing the topic of "job" are added to help students understand the different requirements and target the assignments precisely.
| Actions & New chart report examples |
| Chart questions and samples |
Question:
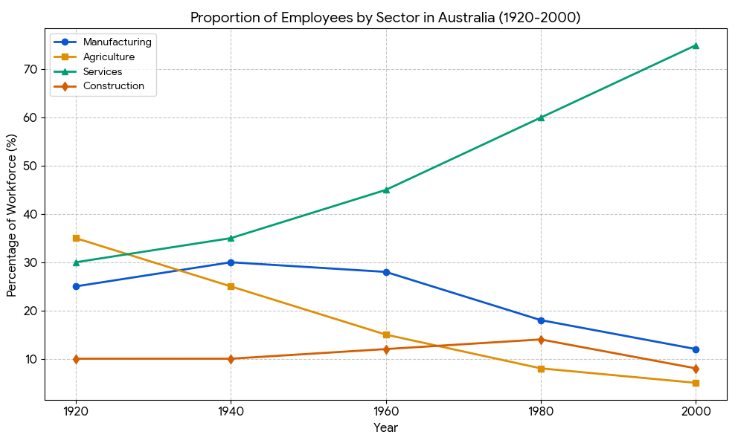
The line graph below shows the changes in the proportion of the Australian workforce employed in four different sectors from 1920 to 2000.
Summarize the information by selecting and reporting the main features, and make comparisons where relevant.
Write at least 150 words.
Summarize the information by selecting and reporting the main features, and make comparisons where relevant.
Write at least 150 words.
Answer 1
The line graph illustrates the percentage of employees working in four distinct job sectors in Australia—Services, Agriculture, Manufacturing, and Construction—between 1920 and 2000...
Overall, the most significant trend was the dramatic rise of the services sector, which became the dominant employer by the end of the period...
In 1920, agriculture was the largest employer, accounting for 35% of the workforce. However, this figure declined steadily over the next 80 years, reaching a low of 5% in 2000...
The services sector started at 30% in 1920 and experienced exponential growth, particularly after 1960...
Band: 8
Word Statistics
| Group | Word Number | Distinct | Percent |
|---|---|---|---|
| All Words | 173 | 108 | 62% |
| Top 300 Words | 65 (37%) | 23 (21%) | 35% |
| 300 - 1000 Words | 26 (15%) | 24 (22%) | 92% |
| Over 1000 Words | 82 (47%) | 61 (56%) | 74% |
Other Comments (scottchapman)
Link Words: 10 (including link phrase: 0)
Sentences: Number: 9; Average Length: 129 characters; Words/Sentence: 19
Repeated Words: and(5), agriculture(3), manufacturing(3), 1920(3), 2000(3), sectors(2), was(2)
Chart Report Questions for Topic : job
Samples
2. The hours worked and stress levels
Samples
3. The proportion of women holding staff and management
Samples
4. The occupations of people who immigrated to Australia
Samples
5. The percentage of women working in different fields in China
Samples
6. The average hours work by part-time and full-time men and women
Samples
7. The duration of housework women did when compared to men
Samples