Chart Report Sample Answer
Chart Report Title: The Hours Worked And Stress Levels
Keywords or Topics: job
The samples about "The hours worked and stress levels" are handy resources for students to enrich their writing skills of chart report.
Besides, more chart report questions sharing the topic of "job" are added to help students understand the different requirements and target the assignments precisely.
| Actions & New chart report examples |
| Chart questions and samples |
Question:
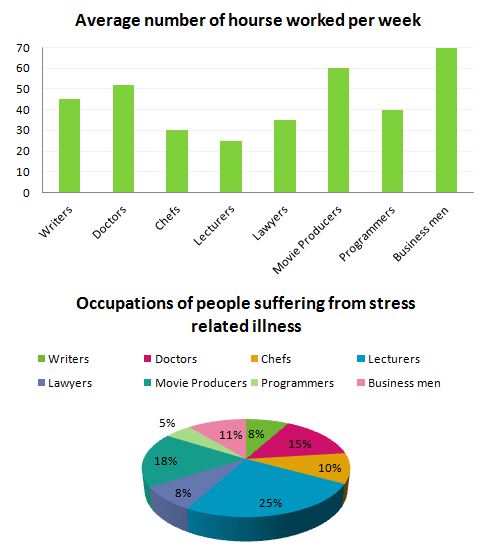
The graphs show figures on hours worked and stress levels among professionals in eight groups.
Describe the information shown to a university or college lecturer.
Write at least 150 words.
Describe the information shown to a university or college lecturer.
Write at least 150 words.
Answer 1
Two graphs present different information about eight professional groups. The bar chart shows the number of weekly work hours for each group, while the pie chart illustrates the percentage of people suffering from stress-related illness across the professions...
In general, businessmen work the longest among the eight groups, while lecturers work the fewest hours...
The bar graph shows that businessmen and movie producers work the most, at about 70 and 62 hours per week, respectively...
The pie graph shows that lecturers have the highest incidence of stress-related illnesses at 25%. Movie producers and doctors also have high rates, at 18% and 15%, respectively...
Band: 8.5
Word Statistics
| Group | Word Number | Distinct | Percent |
|---|---|---|---|
| All Words | 205 | 101 | 49% |
| Top 300 Words | 78 (38%) | 24 (23%) | 30% |
| 300 - 1000 Words | 48 (23%) | 28 (27%) | 58% |
| Over 1000 Words | 79 (38%) | 49 (48%) | 62% |
Other Comments (frankshaw)
Link Words: 12 (including link phrase: 0)
Sentences: Number: 12; Average Length: 109 characters; Words/Sentence: 17
Repeated Words: and(8), hours(7), work(5), lecturers(5), chart(4), shows(3), pie(3)
Chart Report Questions for Topic : job
Samples
2. The proportion of women holding staff and management
Samples
3. The occupations of people who immigrated to Australia
Samples
4. The percentage of women working in different fields in China
Samples
5. The average hours work by part-time and full-time men and women
Samples
6. The duration of housework women did when compared to men
Samples
7. The changes in the proportion of the Australian workforce employed
Samples