Chart Report Sample Answer
Chart Report Title: The Number Of Hospital Beds And Patients Waiting Time
Keywords or Topics: hospital
The samples about "The number of hospital beds and patients waiting time" are handy resources for students to enrich their writing skills of chart report.
Besides, more chart report questions sharing the topic of "hospital" are added to help students understand the different requirements and target the assignments precisely.
| Actions & New chart report examples |
| Chart questions and samples |
Question:
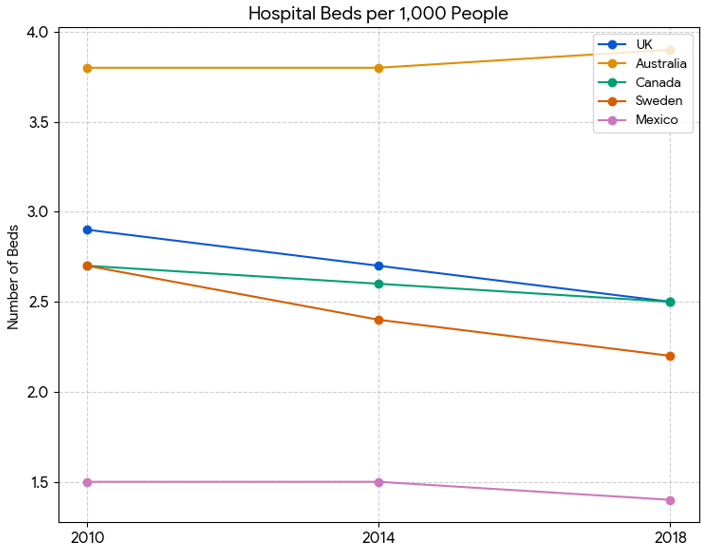
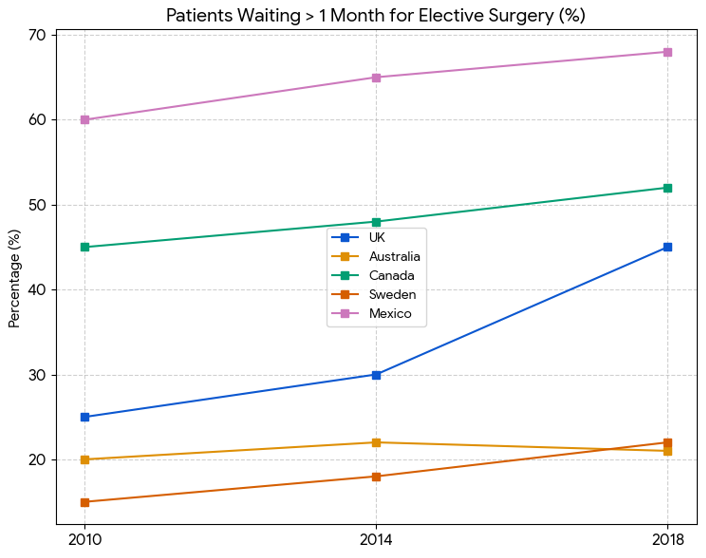
The line graphs below show the number of hospital beds per 1,000 people and the percentage of patients waiting more than one month for elective surgery in five different countries between 2010 and 2018.
Summarize the information by selecting and reporting the main features and make comparisons where relevant.
Write at least 150 words.
Summarize the information by selecting and reporting the main features and make comparisons where relevant.
Write at least 150 words.
Answer 1
The line graphs illustrate changes in hospital bed capacity and the proportion of patients experiencing surgical wait times exceeding one month in the UK, Australia, Canada, Sweden, and Mexico from 2010 to 2018...
Overall, there is a general inverse relationship in most countries: as the number of hospital beds per 1,000 people declined or remained low, the percentage of patients waiting more than one month for elective surgery tended to increase...
Australia stood out as the most stable nation, maintaining the highest bed capacity (rising slightly from 3.8 to 3.9 per 1,000) and keeping long wait times consistently low at approximately 20%...
European and North American trends showed growing pressure on healthcare systems. In the UK and Sweden, bed numbers fell steadily, reaching 2.5 and 2.2, respectively, by 2018...
Band: 8.5
Word Statistics
| Group | Word Number | Distinct | Percent |
|---|---|---|---|
| All Words | 208 | 116 | 55% |
| Top 300 Words | 85 (40%) | 31 (26%) | 36% |
| 300 - 1000 Words | 36 (17%) | 23 (19%) | 63% |
| Over 1000 Words | 87 (41%) | 62 (53%) | 71% |
Other Comments (scottchapman)
Link Words: 11 (including link phrase: 0)
Sentences: Number: 8; Average Length: 157 characters; Words/Sentence: 26
Repeated Words: and(7), bed(4), patients(4), month(4), capacity(3), wait(3), times(3)