Chart Report Sample Answer
Chart Report Title: The Table And Graph Of Internet Searches In US Between 2004 And 2010
Keywords or Topics: internet
The samples about "The table and graph of Internet searches in US between 2004 and 2010" are handy resources for students to enrich their writing skills of chart report.
Besides, more chart report questions sharing the topic of "internet" are added to help students understand the different requirements and target the assignments precisely.
| Actions & New chart report examples |
| Chart questions and samples |
Question:
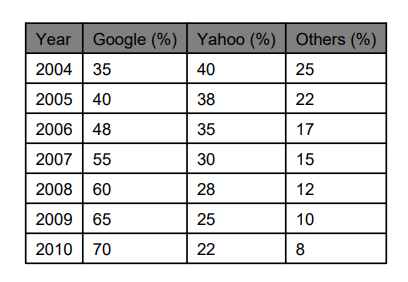
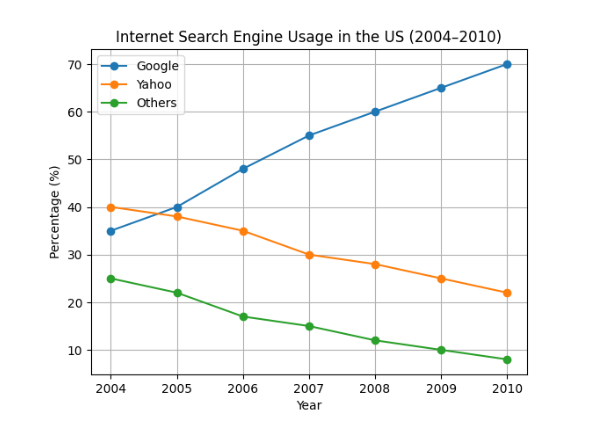
The table and graph below give information about Internet searches in US between 2004 and 2010.
Summarize the information by selecting and reporting the main features and making comparisons where relevant.
Write at least 150 words.
Summarize the information by selecting and reporting the main features and making comparisons where relevant.
Write at least 150 words.
Answer 1
The table and line graph illustrate the proportion of Internet searches conducted via three categories of search engines in the United States between 2004 and 2010...
Overall, Google experienced a significant rise in popularity and became the dominant search engine by the end of the period, whereas Yahoo and other search engines saw a steady decline...
In 2004, Yahoo was the leading platform, accounting for 40% of searches, followed closely by Google at 35%...
In contrast, Yahoo’s share gradually decreased throughout the period, falling from 40% in 2004 to just 22% in 2010...
In summary, the data highlights a clear shift in user preference toward Google, while its competitors lost substantial market share over time...
Band: 8.5
Word Statistics
| Group | Word Number | Distinct | Percent |
|---|---|---|---|
| All Words | 174 | 105 | 60% |
| Top 300 Words | 63 (36%) | 25 (23%) | 39% |
| 300 - 1000 Words | 27 (15%) | 25 (23%) | 92% |
| Over 1000 Words | 84 (48%) | 55 (52%) | 65% |
Other Comments (davidnelson)
Link Words: 10 (including link phrase: 0)
Sentences: Number: 8; Average Length: 131 characters; Words/Sentence: 21
Repeated Words: and(6), google(5), search(4), engines(3), 2004(3), 2010(3), yahoo(3)
Chart Report Questions for Topic : internet
Samples
2. The online shoppers in the USA and Canada in 2012
Samples