Chart Report Sample Answer
Chart Report Title: The Population In A Particular Town In The UK From 1951 To 2011
Keywords or Topics: population
The samples about "The population in a particular town in the UK from 1951 to 2011" are handy resources for students to enrich their writing skills of chart report.
Besides, more chart report questions sharing the topic of "population" are added to help students understand the different requirements and target the assignments precisely.
| Actions & New chart report examples |
| Chart questions and samples |
Question:
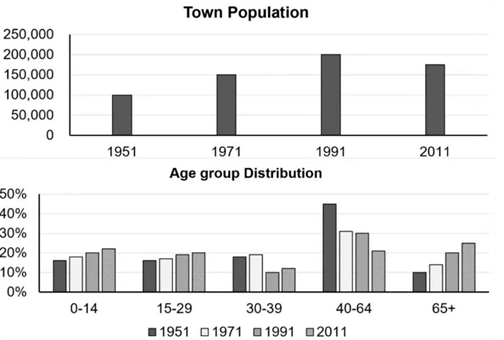
The bar charts below show the information about the population in a particular town in the UK from 1951 to 2011.
Summarize the information by selecting and reporting the main features, and make comparisons where relevant.
Write at least 150 words.
Summarize the information by selecting and reporting the main features, and make comparisons where relevant.
Write at least 150 words.
Answer 1
The bar charts below show how the total population and the proportions of people in different age groups in a UK town changed over 60 years, from 1951 to 2011...
One prominent feature is that the total population initially increased steadily, doubling from 100,000 in 1951 to 200,000 in 1991, then plateaued...
Among the middle-aged population, those aged 30 to 64 years experienced a significant decrease over the 60-year period...
One prominent feature is that the total population initially increased steadily, doubling from 100,000 in 1951 to 200,000 in 1991, then plateaued...
Among the middle-aged population, those aged 30 to 64 years experienced a significant decrease over the 60-year period...
Band: 8
Word Statistics
| Group | Word Number | Distinct | Percent |
|---|---|---|---|
| All Words | 279 | 122 | 43% |
| Top 300 Words | 112 (40%) | 29 (23%) | 25% |
| 300 - 1000 Words | 57 (20%) | 27 (22%) | 47% |
| Over 1000 Words | 110 (39%) | 66 (54%) | 60% |
Other Comments (scottchapman)
Link Words: 17 (including link phrase: 1)
Sentences: Number: 13; Average Length: 126 characters; Words/Sentence: 21
Repeated Words: and(9), age(9), 2011(7), population(6), group(6), from(6), 1951(6)
Chart Report Questions for Topic : population
Samples
2. The ages of the populations of Oman and Spain
Samples
3. The global population percentages and distribution of wealth
Samples
4. The migrant workers and their proportion of the total population
Samples
5. The global population living in urban and rural areas
Samples
6. The population living in the two largest cities compared to others
Samples