Chart Report Sample Answer
Chart Report Title: The Complaints About The Bank Of America
Keywords or Topics: complaint
The samples about "The complaints about the bank of America" are handy resources for students to enrich their writing skills of chart report.
Besides, more chart report questions sharing the topic of "complaint" are added to help students understand the different requirements and target the assignments precisely.
| Actions & New chart report examples |
| Chart questions and samples |
Question:
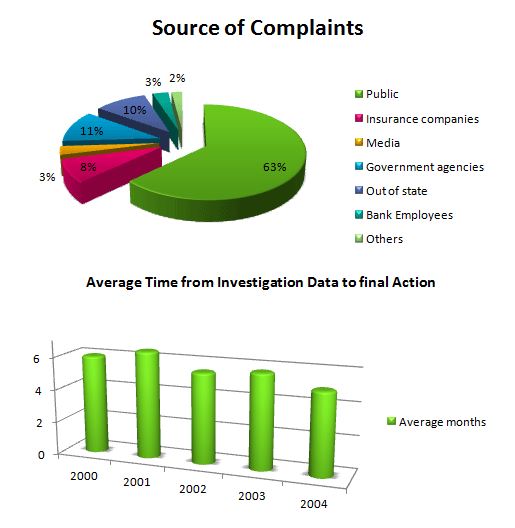
The graphs show the sources of complaints about Bank of America and the time it takes to resolve them.
Summarize the information by selecting the main features, reporting them, and making comparisons where relevant.
Write at least 150 words.
Summarize the information by selecting the main features, reporting them, and making comparisons where relevant.
Write at least 150 words.
Answer 1
The two graphs present different information about complaints at Bank of America. The pie graph shows the sources of complaints, while the bar graph illustrates the average time between the investigation of complaints and the final action taken...
In general, the vast majority of complaints against Bank of America originated from the public. The bar graph shows that the average time between investigation and action is around 5 months...
Of the remaining 37% of complaints, the figures can be grouped into percentages between 11 and 8%, which are made up of government agencies, out-of-state agencies, and insurance companies...
The bar graph shows that 2001 had the highest waiting time for complaints of medical misconduct at 6 months...
Band: 8.5
Word Statistics
| Group | Word Number | Distinct | Percent |
|---|---|---|---|
| All Words | 187 | 96 | 51% |
| Top 300 Words | 83 (44%) | 33 (34%) | 39% |
| 300 - 1000 Words | 39 (20%) | 23 (23%) | 58% |
| Over 1000 Words | 65 (34%) | 40 (41%) | 61% |
Other Comments (frankshaw)
Link Words: 8 (including link phrase: 0)
Sentences: Number: 9; Average Length: 125 characters; Words/Sentence: 20
Repeated Words: complaints(7), and(5), months(5), graph(4), bank(4), average(4), time(4)