Chart Report Sample Answer
Chart Report Title: The Changes In Modes Of Travel In Netherlands
Keywords or Topics: travel
The samples about "The changes in modes of travel in Netherlands" are handy resources for students to enrich their writing skills of chart report.
Besides, more chart report questions sharing the topic of "travel" are added to help students understand the different requirements and target the assignments precisely.
| Actions & New chart report examples |
| Chart questions and samples |
Question:
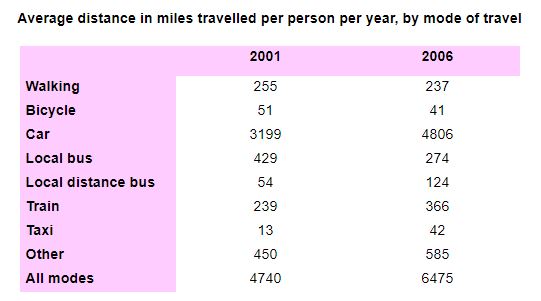
The table below presents changes in modes of travel in the Netherlands between 2001 and 2006.
Describe the information in the table and make comparisons where appropriate.
Write at least 150 words.
Describe the information in the table and make comparisons where appropriate.
Write at least 150 words.
Answer 1
The chart illustrates the average distance travelled by various modes of transport in the Netherlands in 2001 and 2006...
In general, people in the Netherlands travelled more in 2006 than in 2001. Cars posted the highest figures among the given categories...
In detail, a person driving his own car travelled an average of 3,199 miles in 2001, and the average distance rose to 4,806 miles in 2006...
On the other hand, walking and riding bicycles were not more favored by Dutch people. Both categories showed a moderate decline...
Band: 8.5
Word Statistics
| Group | Word Number | Distinct | Percent |
|---|---|---|---|
| All Words | 184 | 99 | 53% |
| Top 300 Words | 80 (43%) | 31 (31%) | 38% |
| 300 - 1000 Words | 38 (20%) | 22 (22%) | 57% |
| Over 1000 Words | 66 (35%) | 46 (46%) | 69% |
Other Comments (frankshaw)
Link Words: 10 (including link phrase: 0)
Sentences: Number: 10; Average Length: 110 characters; Words/Sentence: 18
Repeated Words: miles(8), and(6), from(5), average(4), distance(4), travelled(4), 2001(4)
Chart Report Questions for Topic : travel
Samples
2. The reasons people fly from the airport in the UK in 2016
Samples