Chart Report Sample Answer
Chart Report Title: The Drinking Habits Of The US Population By Age
Keywords or Topics: life style
The samples about "The drinking habits of the US population by age" are handy resources for students to enrich their writing skills of chart report.
Besides, more chart report questions sharing the topic of "life style" are added to help students understand the different requirements and target the assignments precisely.
| Actions & New chart report examples |
| Chart questions and samples |
Question:
The graph shows the drinking habits of the US population by age.
Summarize the information by selecting and reporting the main features, and make comparisons where relevant.
Write at least 150 words.
Summarize the information by selecting and reporting the main features, and make comparisons where relevant.
Write at least 150 words.
Answer 1
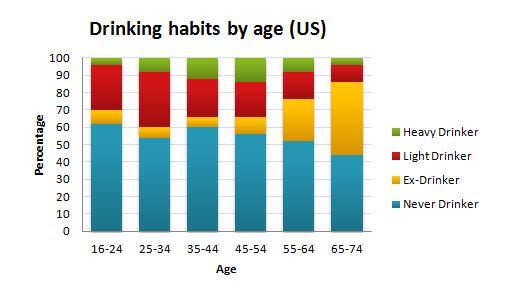
The bar chart shows people’s drinking behavior by age group in the US. Several trends are evident...
The highest proportion of those who never drink (nearly two-thirds) was in the 16 to 24-year-old group...
By contrast, the percentage of those who had quit drinking increased with age. Only 5 percent of those in the youngest age group (16 to 24) were ex-drinkers, compared with roughly 40 percent of those aged 65 to 75...
The percentage of those classified as heavy drinkers also showed a distinct pattern. People in middle age (35 to 54) tended to be the heaviest drinkers – approximately 13 percent of the total...
Overall, age appears to be a significant factor in patterns of drinking behavior...
Band: 8.5
Word Statistics
| Group | Word Number | Distinct | Percent |
|---|---|---|---|
| All Words | 167 | 82 | 49% |
| Top 300 Words | 75 (44%) | 23 (28%) | 30% |
| 300 - 1000 Words | 27 (16%) | 13 (15%) | 48% |
| Over 1000 Words | 65 (38%) | 46 (56%) | 70% |
Other Comments (larryausten)
Link Words: 4 (including link phrase: 0)
Sentences: Number: 11; Average Length: 87 characters; Words/Sentence: 15
Repeated Words: age(7), those(7), group(5), percent(5), drinking(3), proportion(3), with(3)
Chart Report Questions for Topic : life style
Samples