Chart Report Sample Answer
Chart Report Title: The Size Of US Households
Keywords or Topics: family
The samples about "The size of US households" are handy resources for students to enrich their writing skills of chart report.
Besides, more chart report questions sharing the topic of "family" are added to help students understand the different requirements and target the assignments precisely.
| Actions & New chart report examples |
| Chart questions and samples |
Question:
The table below presents statistics on the size of US households over several years. Study the information and answer the question.
Write a short report for a university lecturer describing the information shown below.
(Household = all the people living together in one house.)
Write at least 150 words.
Write a short report for a university lecturer describing the information shown below.
(Household = all the people living together in one house.)
Write at least 150 words.
Answer 1
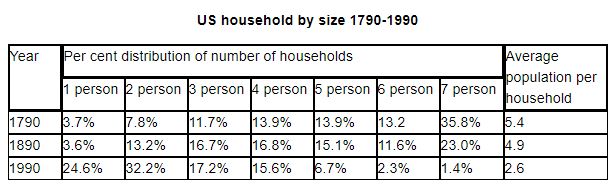
The table illustrates changes in the percentage distribution of US households by household size, along with the average number of people per household, for three specific years: 1790, 1890, and 1990...
The most striking trend is the dramatic shift from large to small households. In the late 18th century, the majority of Americans lived in large groups, whereas by the late 20th century, the trend had inverted to favor one- or two-person living arrangements...
In 1790, households with seven or more people were the most common, accounting for 35.8% of the total...
Conversely, small households saw exponential growth. In 1790 and 1890, single-person households accounted for roughly 3.7% of households...
Band: 9
Word Statistics
| Group | Word Number | Distinct | Percent |
|---|---|---|---|
| All Words | 207 | 110 | 53% |
| Top 300 Words | 88 (42%) | 32 (29%) | 36% |
| 300 - 1000 Words | 37 (17%) | 27 (24%) | 72% |
| Over 1000 Words | 82 (39%) | 51 (46%) | 62% |
Other Comments (alexgates)
Link Words: 8 (including link phrase: 0)
Sentences: Number: 12; Average Length: 108 characters; Words/Sentence: 17
Repeated Words: households(11), with(5), for(5), 1790(4), 1990(4), large(4), people(3)
Chart Report Questions for Topic : family
Samples
2. The Marriage and Divorce Statistics for nine countries
Samples
3. The duration of housework women did when compared to men
Samples