Chart Report Sample Answer
Chart Report Title: The The Number And The Proportion Of Passenger Vehicles In Australia
Keywords or Topics: sale, car
The samples about "The the number and the proportion of passenger vehicles in Australia" are handy resources for students to enrich their writing skills of chart report.
Besides, more chart report questions sharing the same topic are linked to help students understand the different requirements and target the assignments precisely. The current chart report has two topics: sale and car. So, chart report questions about them are listed separately.
| Actions & New chart report examples |
| Chart questions and samples |
Question:
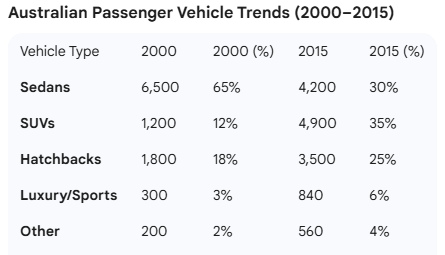
The table below shows the number (in thousands) and the proportion (%) of five different types of passenger vehicles in Australia between 2000 and 2015.
Summarize the information by selecting and reporting the main features, and make comparisons where relevant.
Write at least 150 words.
Summarize the information by selecting and reporting the main features, and make comparisons where relevant.
Write at least 150 words.
Answer 1
The table compares five categories of passenger vehicles in Australia based on sales figures and market share in 2000 and 2015...
Overall, the Australian automotive market underwent a significant transformation over the fifteen-year period...
In 2000, sedans were the dominant vehicle type, with 6,500 units sold, accounting for a substantial 65% of the market...
Other vehicle types also saw upward trends. Hatchback sales nearly doubled from 1,800 to 3,500, increasing their share from 18% to a quarter of the market...
Band: 8
Word Statistics
| Group | Word Number | Distinct | Percent |
|---|---|---|---|
| All Words | 185 | 112 | 60% |
| Top 300 Words | 71 (38%) | 29 (25%) | 40% |
| 300 - 1000 Words | 20 (10%) | 16 (14%) | 80% |
| Over 1000 Words | 94 (50%) | 67 (59%) | 71% |
Other Comments (scottchapman)
Link Words: 13 (including link phrase: 0)
Sentences: Number: 10; Average Length: 115 characters; Words/Sentence: 18
Repeated Words: market(7), and(6), 2015(4), vehicles(3), share(3), 2000(3), sedans(3)
Chart Report Questions for Topic : sale
Samples
2. 'Istanbul Promo plus' sales
Samples
3. The spending habits of shopping on consumer goods
Samples
4. The sales figures for reading materials
Samples
5. The worldwide market share of the mobile phone
Samples
6. The monthly contract cost for four leading mobile phone brands
Samples