Chart Report Sample Answer
Chart Report Title: The Average Monthly Rainfall For The Two Largest Cities In Brazil
Keywords or Topics: weather
The samples about "The average monthly rainfall for the two largest cities in Brazil" are handy resources for students to enrich their writing skills of chart report.
Besides, more chart report questions sharing the topic of "weather" are added to help students understand the different requirements and target the assignments precisely.
| Actions & New chart report examples |
| Chart questions and samples |
Question:
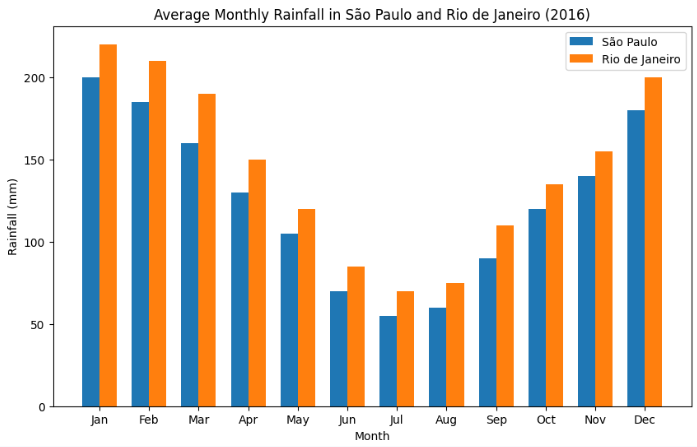
The bar chart below shows the average monthly rainfall (in millimetres) for the two largest cities in Brazil, São Paulo and Rio de Janeiro, in 2016.
Summarize the information by selecting and reporting the main features and make comparisons where relevant.
Write at least 150 words.
Summarize the information by selecting and reporting the main features and make comparisons where relevant.
Write at least 150 words.
Answer 1
The bar chart compares the average monthly rainfall in São Paulo and Rio de Janeiro, the two largest cities in Brazil, throughout the year 2016...
Overall, both cities experienced their highest rainfall at the beginning and end of the year, with the wettest months being January and December...
In January, Rio de Janeiro recorded around 220 mm, slightly more than São Paulo’s 200 mm. February and March followed a similar pattern, with both cities seeing heavy rainfall, but Rio maintained a lead of about 20–25 mm...
After August, precipitation began rising again. By December, rainfall peaked at about 200 mm for Rio and 180 mm for São Paulo...
In summary, although both cities showed similar seasonal patterns, Rio de Janeiro consistently recorded marginally higher monthly rainfall than São Paulo in 2016...
Band: 8
Word Statistics
| Group | Word Number | Distinct | Percent |
|---|---|---|---|
| All Words | 195 | 98 | 50% |
| Top 300 Words | 59 (30%) | 24 (24%) | 40% |
| 300 - 1000 Words | 32 (16%) | 24 (24%) | 75% |
| Over 1000 Words | 104 (53%) | 50 (51%) | 48% |
Other Comments (kewalotrump)
Link Words: 11 (including link phrase: 0)
Sentences: Number: 10; Average Length: 117 characters; Words/Sentence: 19
Repeated Words: rainfall(7), and(7), rio(7), são(6), cities(6), paulo(5), both(5)
Chart Report Questions for Topic : weather
Samples